Monitoring My Energy Usage (Part 1)
Published on
Recently I've been thinking about ways in which I can take control and save money. A good candidate for this in my view is energy consumption. It's commonly acknowledged these days that having a large carbon footprint makes you single-handedly responsible for the deaths of all polar bears and who knows what else, so it also has a nice "eco" twist as well. Extra karma points...?
Getting In Control
I am of the opinion that it is not really possible to manage and reduce this in any meaningful way (besides the obvious) without having any way to visualise and analyse the usage. Because of this, the first step in my plan for conservation of energy is to devise a way to log, store and analyse my usage.
I am going to focus initially on electricity, primarily because it is the energy source over which I have the most control. Gas powers only the hot water/heating and cooker hobs, so the amount of change I would be able to effect over this is somewhat minimal.
A Rubbish Solution
Up until this point I have been occasionally reading the meter and entering the readings into an Excel spreadsheet (and more recently, a very quickly-put-together web app) which then takes each reading and does some maths. For each reading, it works out the amount of units used per hour since the previous reading. It's all very basic and has some definite drawbacks:
- It is dependant on me reading the meter at regular intervals. Since my meter reading frequency is the sample rate, the more the better. Needless to say, I'm not going to be out there reading it each hour!
- It only gives a very basic overview of the general trends—there is no way to determine what (if anything in particular) is causing spikes or dips in usage. About all I have been able to determine is that when there are more people in the flat (i.e. someone comes to visit), the usage tends to rise.
Throwing Hardware at the Problem
Having looked around for a while, I discovered that there are several energy monitors which have the ability to connect to a PC via USB:
- Wattson
- Owl +USB (and a couple of others in their range)
- Current Cost Envi (and their forthcoming EnviR)
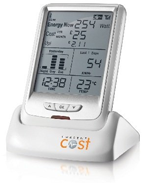
All of these devices seem pretty good, and the Wattson is definitely a smart looking device. However I opted for the Current Cost Envi, as it is relatively low-priced and is able to constantly supply readings via XML. In addition, plenty of others have already built custom systems for logging their data, which provides some useful information on what works and what doesn't.

The Goal
Like the others above, my next aim for this is to build a logging system to take the data produced by the Envi (once it arrives) and store it. This will give me the means to build an application which is able to take this stored data and give me pretty graphs and other visualisations. As most geeks would agree, this now makes it a fun project, and even better than that, it's going to produce lots of lovely data. It also gives my home server a nice new function alongside all its current duties.
Once this system is in place, I will be able to use it to help me change behaviours in order to save electricity (and money). Since it will end up operating in near real-time, I imagine it giving a good insight into what devices are power-hungry and address the issue of whether having lots of devices on standby really make that much difference.
Once the device arrives and I have built up the logging system, I'll write about happens in part 2.